Report
Report is feature from RUN System Platform that allows you to visualize data, create dashboard and report from your application's data and other data source using feature External Data Source.
With Report you can transform SQL queries into various different type of visualization like Table, Bar, Line, Pie and Counter, these visualizations will be used on Screen as a Component.
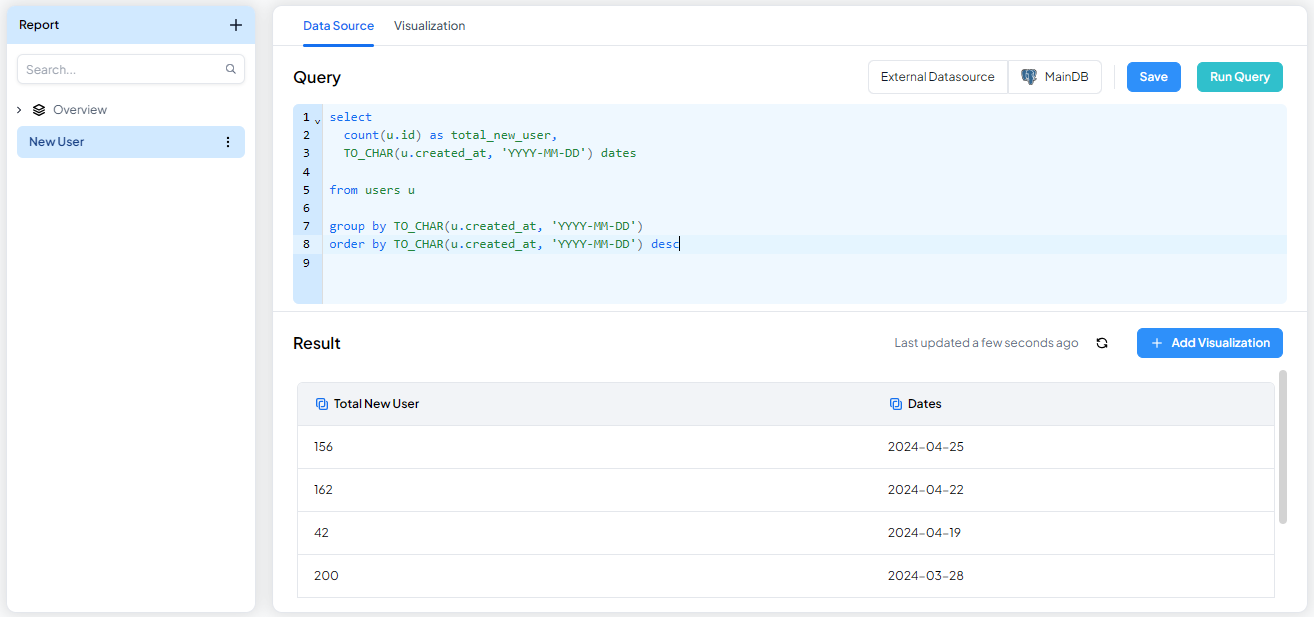 Report Editor
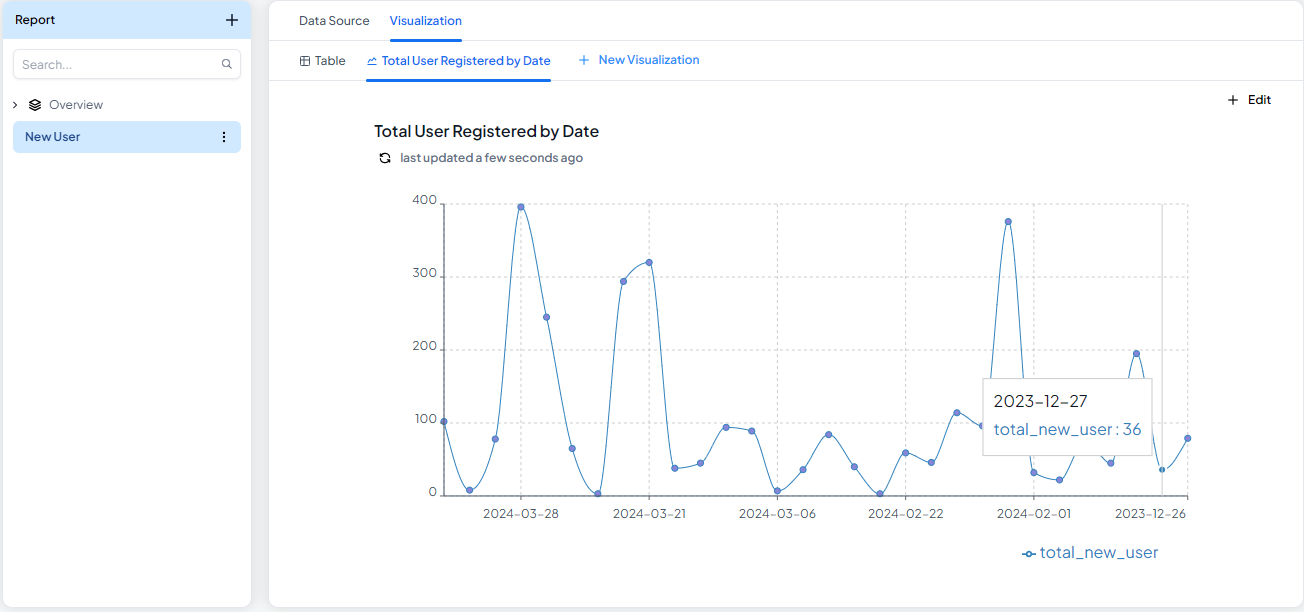 Visualization Editor
Create Report
To create new report first click + Button on left sidebar, dialog box will appear, give name and select Resource. If you want to create report from your application data, choose Entity, if you want to create report from another data resource outside RUN System Platform choose External Data Source.
Write Query
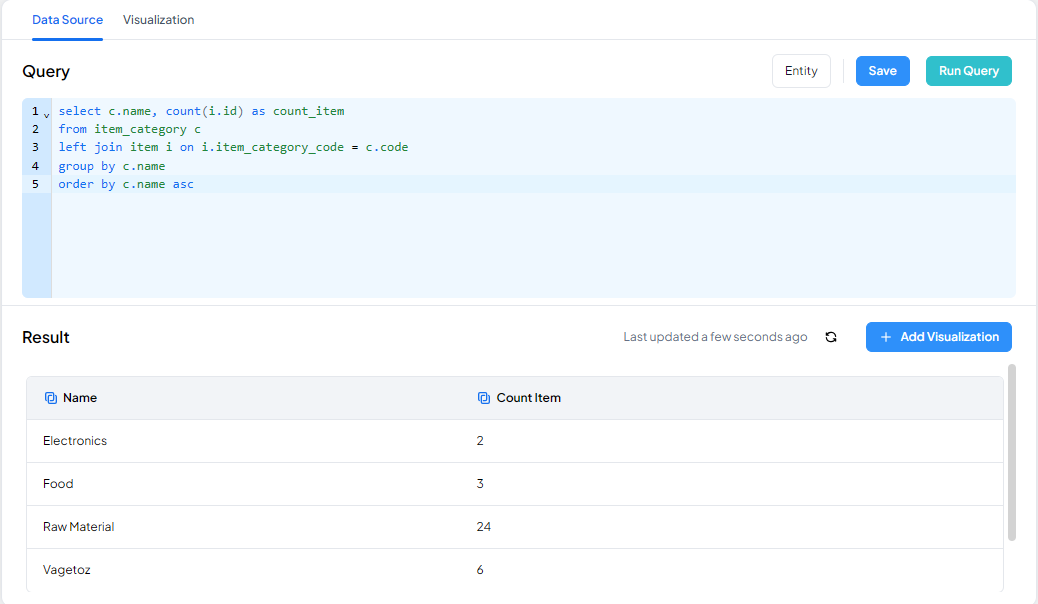
After report created, next step is write your SQL query on textarea
Run Query
You can try your query first to see the result using Run Query Button. Theres will be result of query below the textarea.
Save Query
If you sure with your query, you can save using Save Button, dont worry you can edit your query anytime.
Rename and Delete
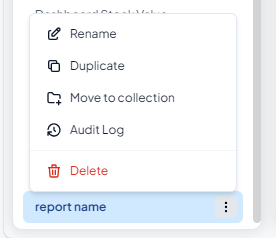
To rename your report, simply click triple dot button on active report, choose Rename, type new name, and click Save button. If you want to delete, choose Delete.
Create Visualization
By default report will create visualize type Table, but you can create another visualize type.
Simply step is click Vizualization tab button.
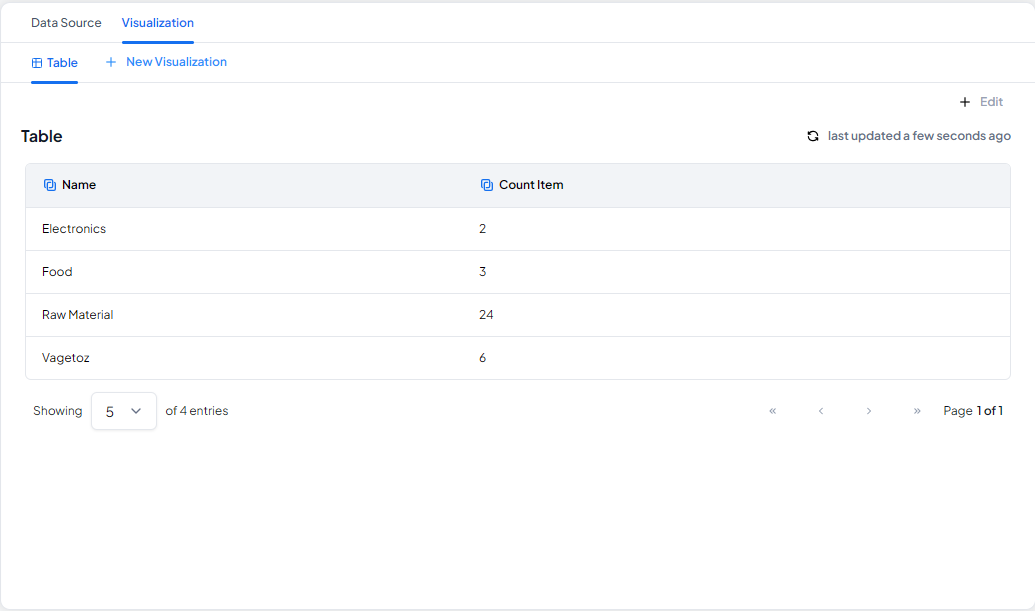
Click New Visualization, and it will show a dialog box.
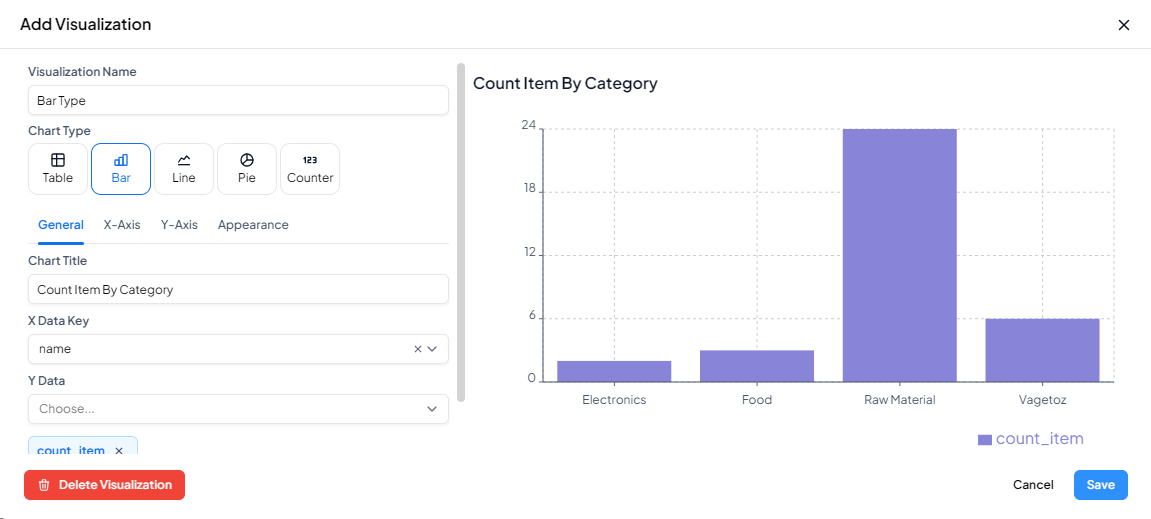
Complete Visualization Name, Chart Type, and Chart Title. Each chart type may have a different config.
Click Save to save visualzation.
Attach To Screen
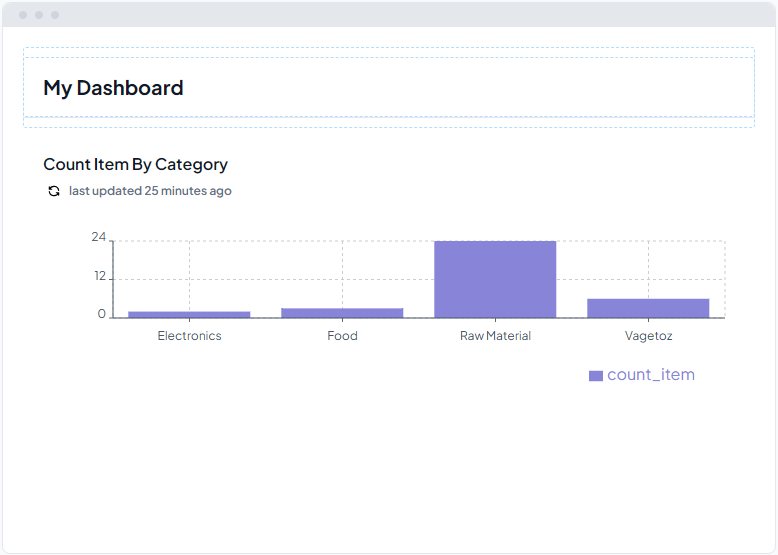
To display report on Application, you must attach report into Screen, all visualization on report will be read as report component that can used on Screen.
Create new Screen or use existing, add report component grouped on Data section.
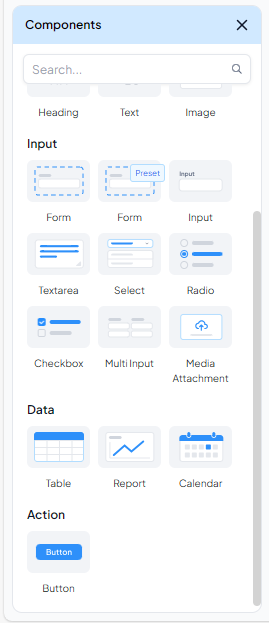
Setup report by select report and visualization type
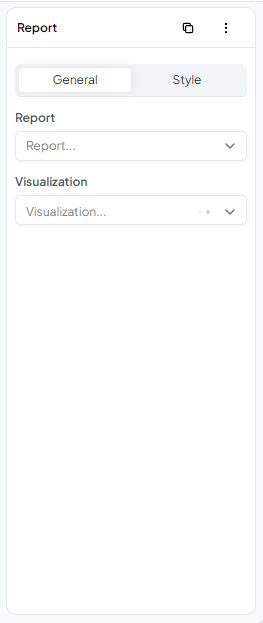
Now your report attached to Screen
