Report Component
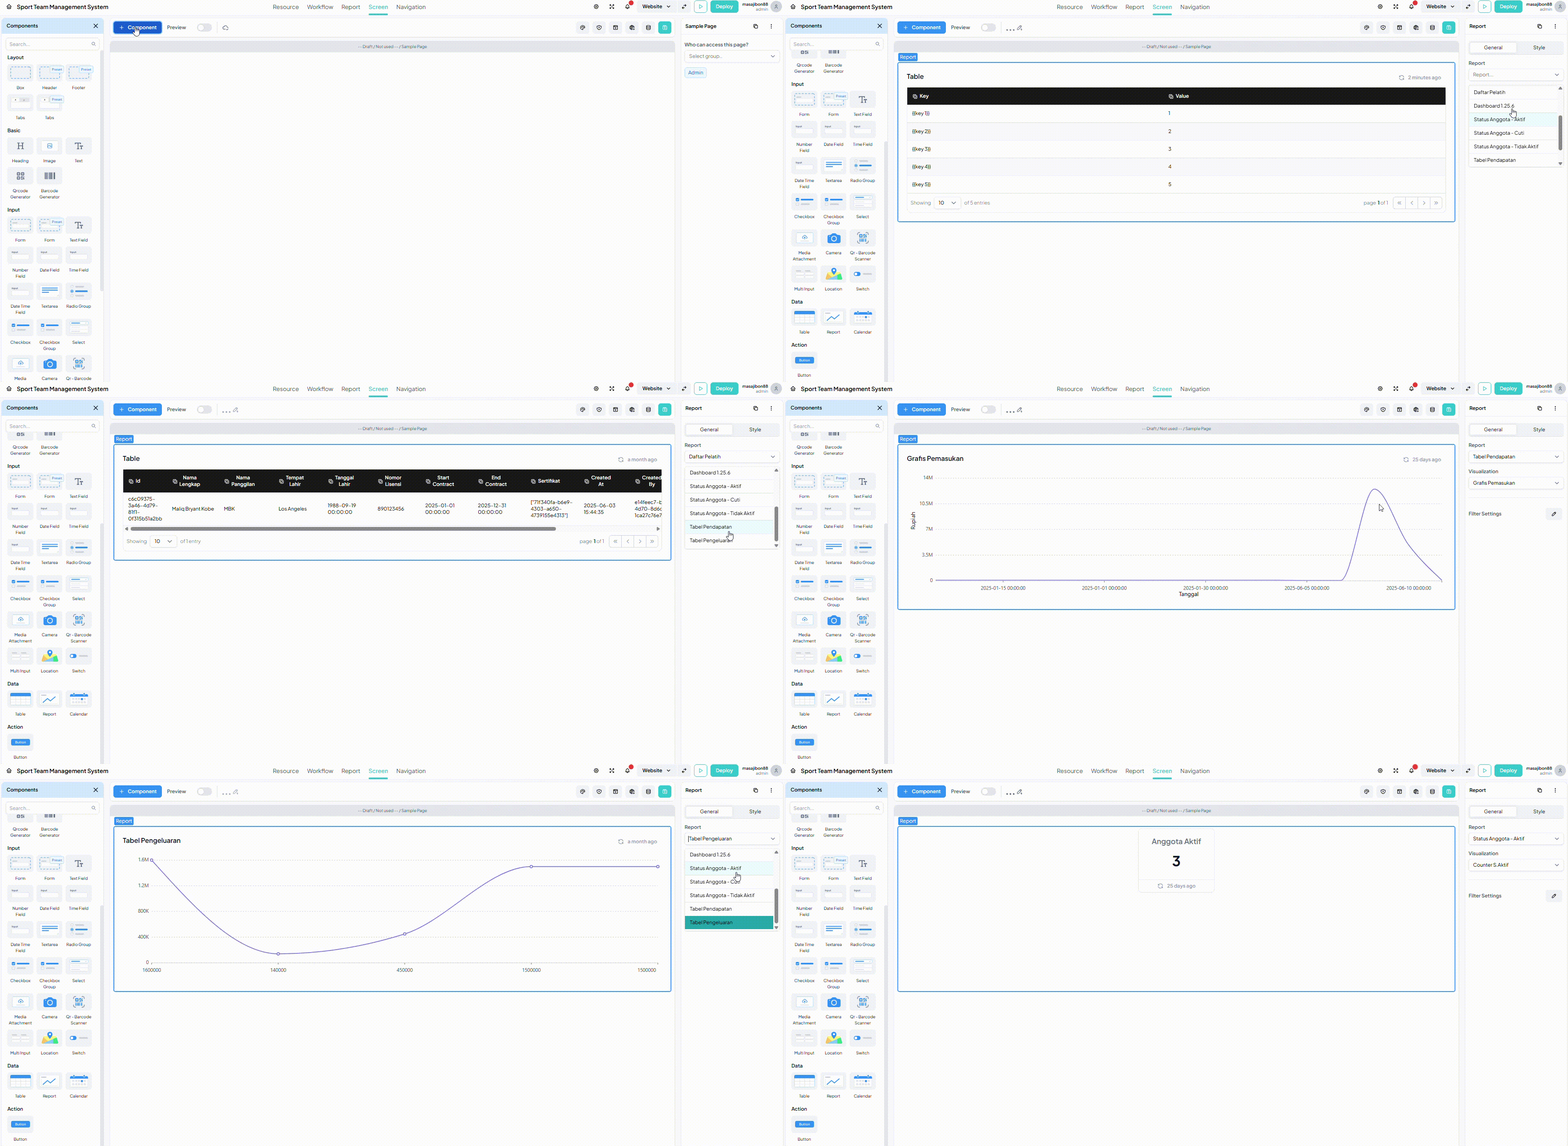
In the report component, you can display various types of data in visual form. The data can be in the form of charts, diagrams, counters, charts, and tables. Its use is quite easy and simple, namely make sure you drag & drop the "Report" component on your Screen.
In the Report Component, you can set up based on the Report and Visualization you want to display. You can also use Filter Settings to filter the desired Report.
info
By default the display on the report will display the table, so it must be noted that what is displayed is
an example of the display of the table, not a Table Component.
warning
Make sure you have created the data you want to visualize in the Report menu. If you do not set the visual data there, the data will not be displayed.
